

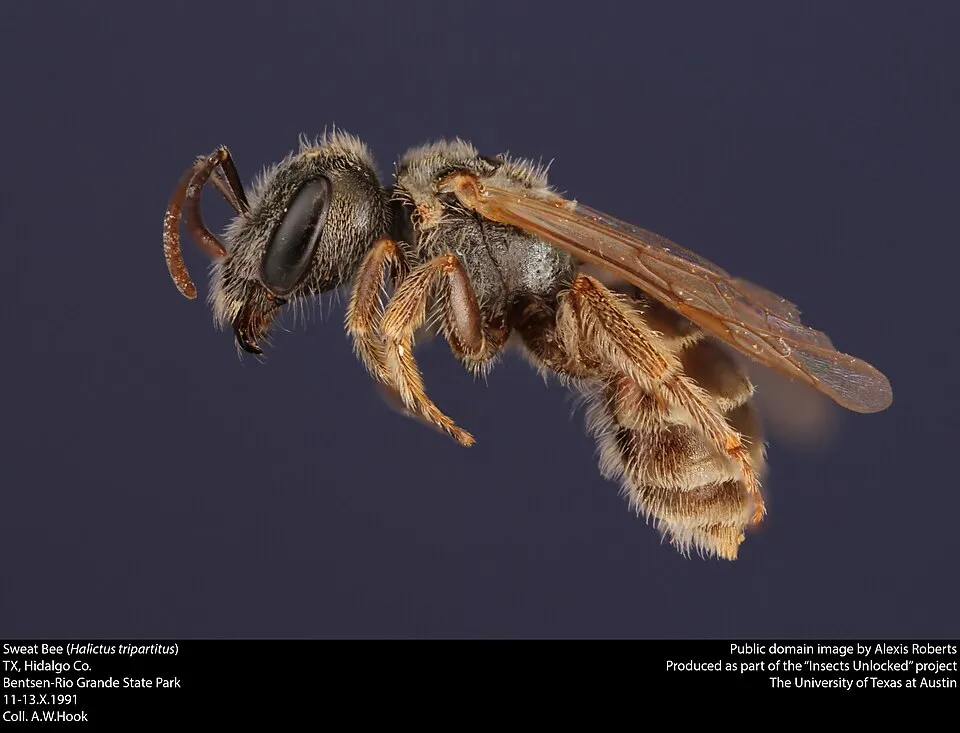
Insect
Tripartite Sweat Bee
Halictus tripartitus9,738 records © Insects Unlocked from USA · CC0-1.0
United States · Terrestrial
National park of 98,240 hectares in the United States, established in 1939.
National park of 98,240 hectares in the United States, established in 1939.
Badlands National Park is located in the United States (North America). It is a predominantly terrestrial area. Established on 25 January 1939, it covers about 98,240 hectares. The site is managed by National Park Service.
In the United States (North America). Representative point: 43.7500° N, 102.5000° W.
About 98,240 hectares (982 km²). It is the 27th largest of the 62 national parks in the United States covered by Parkavela.
On 25 January 1939.
A terrestrial area, where land cover is dominated by grassland and meadows (89%).
Cedar Butte, at 998 m (OpenStreetMap).
Cedar Butte (998 m), Galigo Table (975 m), Sheep Mountain Table (958 m), Blindman Table (943 m) and Plenty Star Table (935 m) (OpenStreetMap).
Best time to visit: August and September, with average temperatures of 18 to 24 °C and moderate rainfall.
Yes. According to NASA's MODIS satellites (2015–2025 average), snow covers the site about 40 days a year, mostly from December to February.
Nearest airport: Rapid City Regional (RAP), about 45 km away.
White River Visitor Center and Ben Reifel Visitor Center.
Yes. Waymarked hiking routes listed in OpenStreetMap: 5. The “Castle Trail” route runs for about 8 km through the site.
Among the species most often recorded on GBIF are Halictus tripartitus (Tripartite Sweat Bee), Lasioglossum semicaeruleum, Lasioglossum pruinosum (Hoary Sweat Bee) and Sturnella neglecta (Western Meadowlark).
National Park Service.
© OpenStreetMap
Download the boundary: GeoJSON · GPX Boundary © OpenStreetMap contributors (ODbL).
The representative point of the site lies at around 843 m above sea level. Over the 1996–2025 period, the mean annual temperature is about 9.8 °C and total precipitation reaches roughly 482 mm per year. The warmest month is usually July, the coolest January, and the wettest May.
Terrain: Mapzen Terrain Tiles (SRTM, USGS)
Data © OpenStreetMap contributors (ODbL)
● Mean temperature (°C) · ▮ Precipitation (mm)
Source: Copernicus ERA5-Land (C3S, doi:10.24381/cds.68d2bb30), monthly averages 1996–2025 interpolated to the representative point, temperatures adjusted for elevation.
Contains modified Copernicus Climate Change Service information 2026. Neither the European Commission nor ECMWF is responsible for any use that may be made of the Copernicus information or data it contains.
average share of the site under snow · snowiest parts · ≈ 40 days a year
Snow cover: MODIS/Terra MOD10CM v61 (Hall & Riggs, 2021, NASA NSIDC DAAC, doi:10.5067/MODIS/MOD10CM.061), imagery from NASA GIBS (ESDIS); 2015–2025 average, grid of about 5 km.
According to the global MODIS land cover (NASA, 2024), the site is mainly made up of grassland and meadows (89%) and bare rock and scree (11%). Elevation ranges from about 740 m to 998 m (highest point: Cedar Butte).
Based on occurrences aggregated by GBIF, several species are regularly recorded within the site. Among the most frequent are Halictus tripartitus (Tripartite Sweat Bee), Lasioglossum semicaeruleum, Lasioglossum pruinosum (Hoary Sweat Bee) and Sturnella neglecta (Western Meadowlark). The full list of documented taxa is shown below.
Insect
9,738 records © Insects Unlocked from USA · CC0-1.0
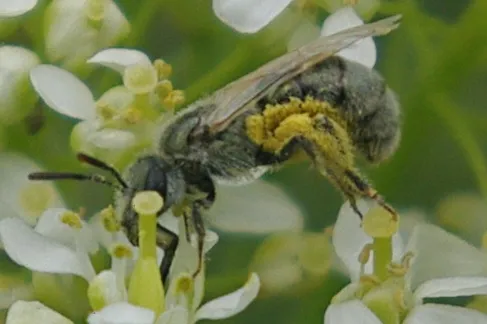
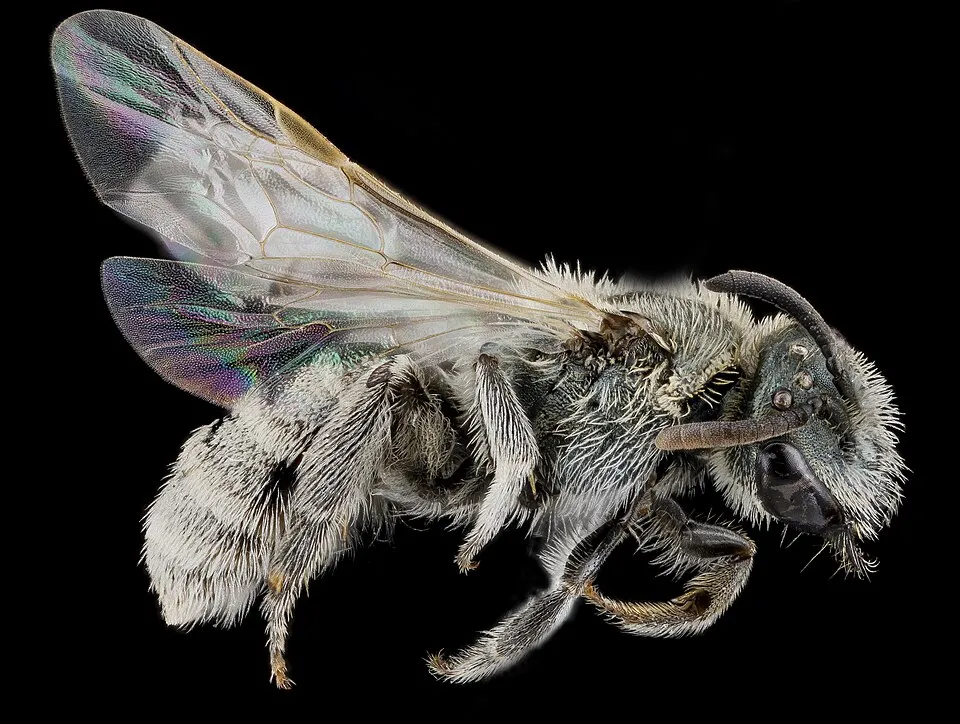
Insect
6,075 records © USGS Native Bee Inventory and Monitoring Laboratory from Beltsville, USA · Public domain
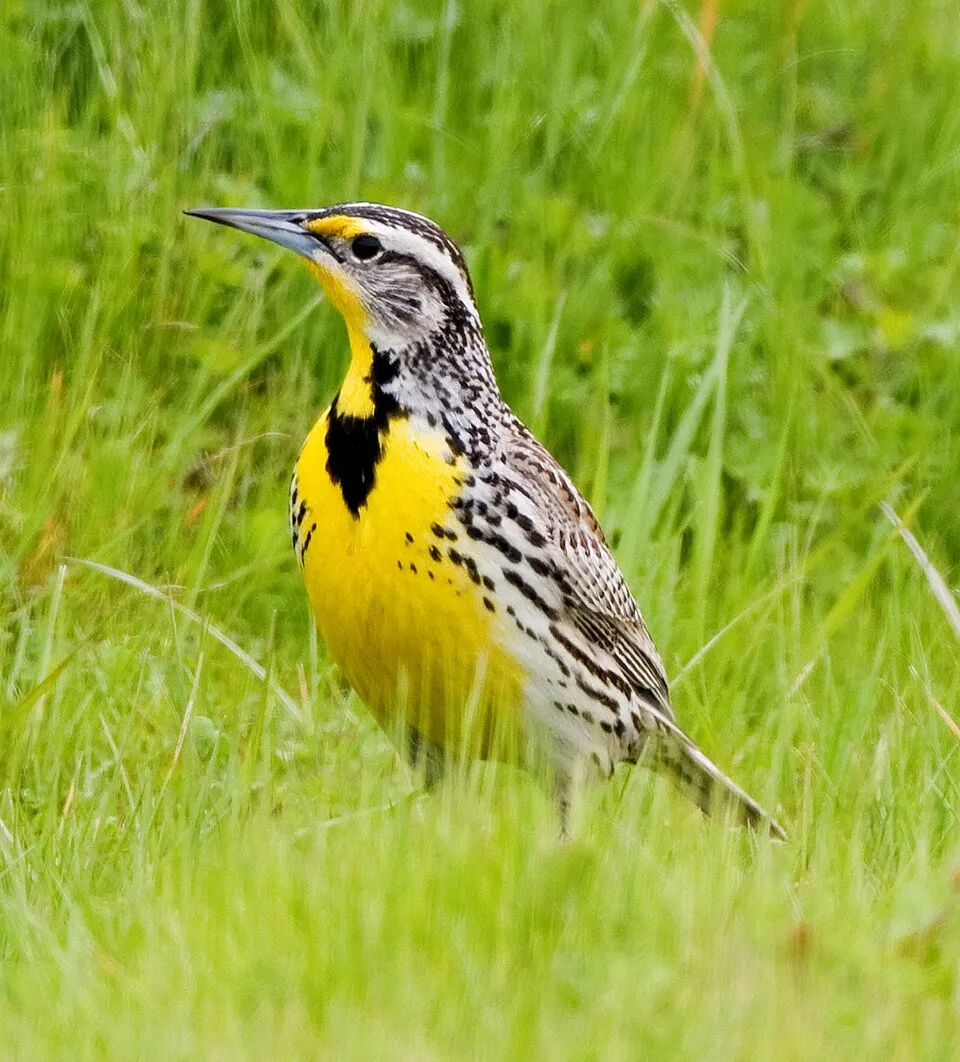
Bird
5,834 records © Kevin Cole from Pacific Coast, USA (Kevinlcole) · CC BY 2.0
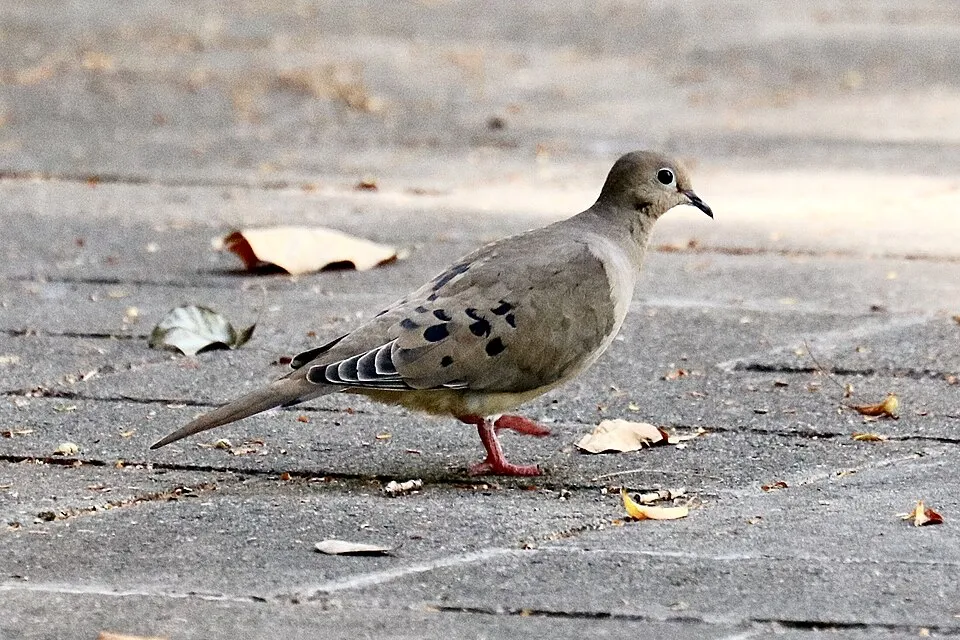
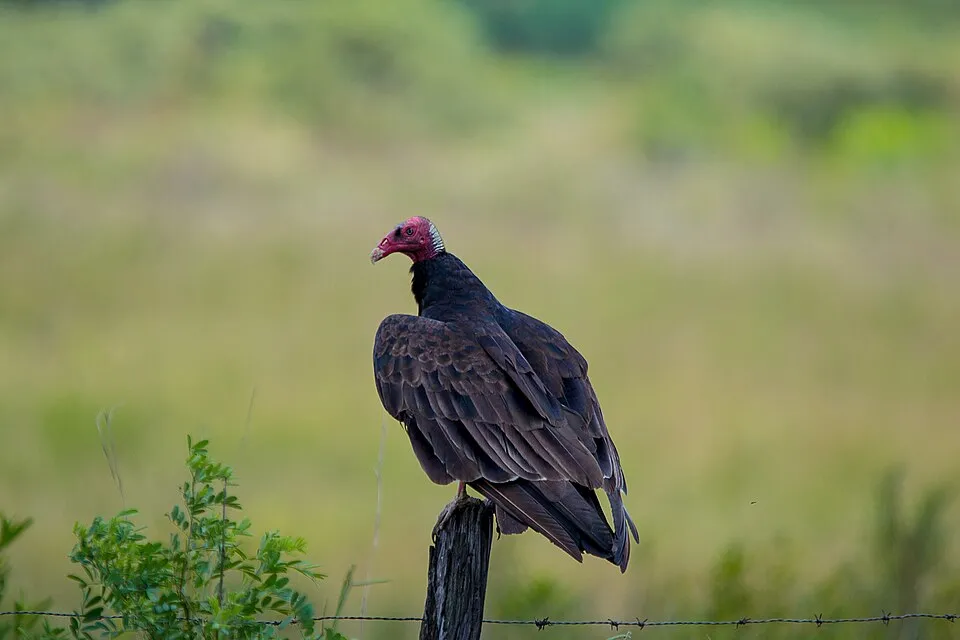
Occurrences documented via GBIF; they are neither an exhaustive inventory nor proof of current presence.
Records: GBIF.org (CC-BY). Names: Wikidata (CC0), GBIF. Photos: Wikimedia Commons.
The primary purpose of the site is to preserve its natural habitats and the biodiversity they support. The species recorded (Biodiversity tab) reflect its ecological value. Its status as a national park sets the regulatory framework for its protection.
At night, the area gives off virtually no artificial light detectable from space (NASA VIIRS Black Marble composite, 2016).
0%
of the area gives off artificial light visible from space
Sources: Global Forest Change (Hansen et al., University of Maryland, via Global Forest Watch, CC-BY 4.0); EFFIS, European Commission / Copernicus; NASA Black Marble 2016 (public domain); CORINE Land Cover 2018 (Copernicus) or MODIS.
61 public car parks listed within the site · 2 trailheads
5 waymarked routes listed
Data © OpenStreetMap contributors (ODbL) · Wikidata (CC0)
Tracks © OpenStreetMap contributors (ODbL), clipped to the boundary; elevation gain and profiles computed on the longest section from Mapzen Terrain Tiles (≈ 30 m), indicative only.
Nearest airport: Rapid City Regional (RAP), about 45 km away. About 6,000 people live within 20 km of the site boundary, 2,000 of them within 10 km; some 80 people are estimated to live inside (GHSL estimate, 2020). Visitor information on site: White River Visitor Center and Ben Reifel Visitor Center. Public car parks listed within the site: 61, including Fossil Exhibit Trail parking and Door/Window Viewpoint. Waymarked hiking routes listed in OpenStreetMap: 5. To plan a visit (access, opening periods, visitor rules), it is best to consult the official information from the managing body (National Park Service) and the official website listed in this page's sources.
Source: OpenStreetMap (ODbL), Wikidata (CC0), October 2026.
Best time to visit: August and September, with average temperatures of 18 to 24 °C and moderate rainfall. Average temperatures drop below 0 °C from December to February: frost is common. Precipitation peaks in May (up to 90 mm per month). According to NASA's MODIS satellites (2015–2025 average), snow covers the site about 40 days a year, mostly from December to February. Day length ranges from about 8 h 56 min in December to 15 h 26 min in June. Wildlife records published on GBIF peak for birds (June), plants (June and July), butterflies and moths (July) and mammals (October). These peaks also reflect when observers are most active.
Source: Copernicus ERA5-Land (C3S), monthly averages 1996–2025 at the representative point, temperatures adjusted for elevation.
Contains modified Copernicus Climate Change Service information 2026. Neither the European Commission nor ECMWF is responsible for any use that may be made of the Copernicus information or data it contains.
Monthly records published on GBIF (CC-BY), relative to the busiest month; also reflects observer activity.
Data © OpenStreetMap contributors (ODbL), Wikidata (CC0) and the sources cited.
